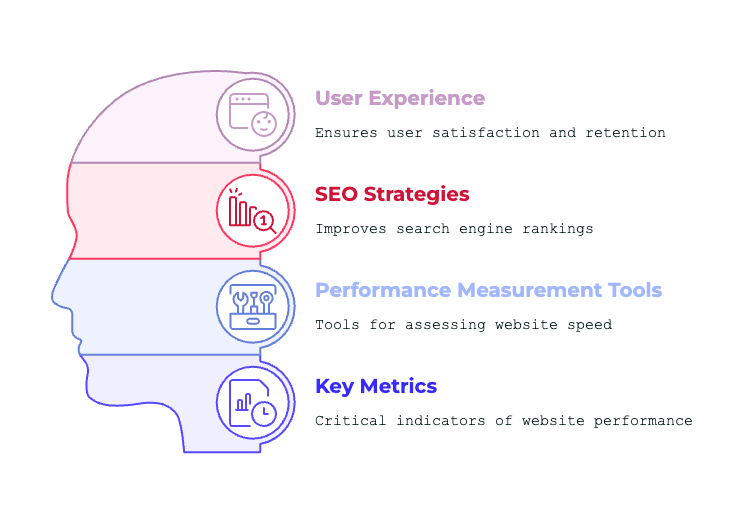
Consistently checking your site performance, improving user-friendliness, and solid on-site SEO strategies have become non-negotiable. Regularly measuring and improving your website’s performance ensures a better user experience and helps keep up with SEO competition.
This article covers the best tools for web performance measurement, their functionalities, and practical applications. We’ll also provide real-world examples, actionable insights, and suggestions for infographics and graphs to visualize key concepts.
Why Website Performance Matters?
Impact on User Experience
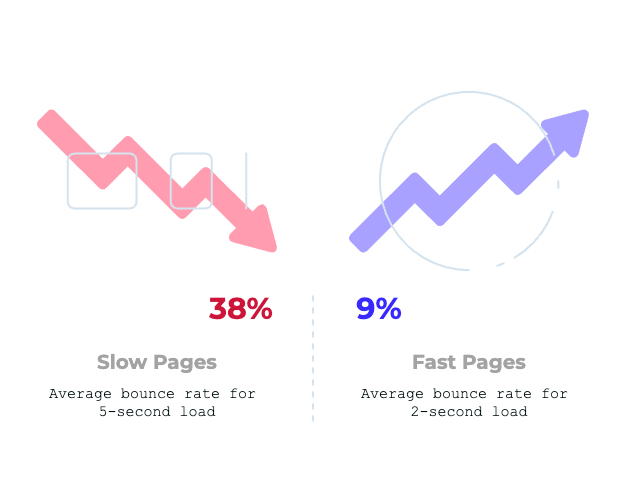
Website performance directly affects user experience. Slow-loading pages frustrate users, leading to higher bounce rates and lower engagement, ultimately impacting conversions and sales. A fast website can help visitors move around your website easily and stay for longer.
Pages that load within 2 seconds have an average bounce rate of 9%, while pages that take 5 seconds to load experience a 38% bounce rate (Pingdom).
SEO & Search Engine Rankings
Google considers website speed a ranking factor. A fast website can improve search engine optimization (SEO), the website ranking on Google (SERPs), and more. Core Web Vitals are particularly important for SEO.
Conversion Rates & Revenue
Website speed impacts conversion rates. Studies show that even a one-second delay in page load time can reduce conversions by 7%. Faster sites encourage users to complete transactions, improving revenue. According to WebFX, slow websites cost businesses $2.6 billion annually in lost revenue.
Key Metrics for Website Performance
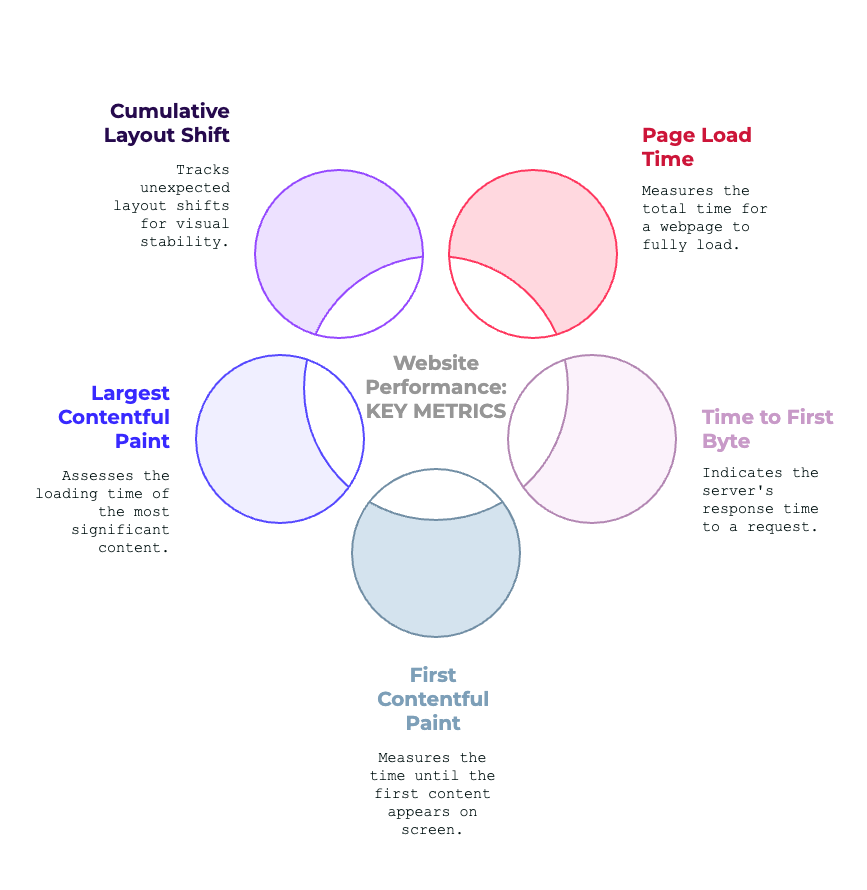
Page Load Time
This metric measures the total time it takes for a webpage to fully load, including all images, scripts, and stylesheets.
Time to First Byte (TTFB)
TTFB indicates the time it takes for a server to respond to a request. A lower TTFB means a more responsive server.
First Contentful Paint (FCP)
FCP measures when the first piece of content appears on the screen. Faster FCP enhances perceived performance.
Largest Contentful Paint (LCP)
LCP assesses how long it takes for the most significant visible content (like an image or text block) to load. A good LCP score is under 2.5 seconds.
Cumulative Layout Shift (CLS)
CLS measures visual stability by tracking unexpected layout shifts. A lower CLS score means fewer content jumps.
First Input Delay (FID)
FID measures the delay between when the user interacts with the page and when the browser can respond to that interaction.
Top Tools for Measuring Website Performance
1. Google PageSpeed Insights
Overview:Google PageSpeed Insights examines your website on both desktop and mobile and provides recommendations for improvements. Google states that sites with higher PageSpeed scores have 24% lower bounce rates (Think with Google).
Key Features:
- Measures Core Web Vitals (LCP, FID, CLS).
- Provides performance scores out of 100.
- Offers specific optimization suggestions, such as image compression or JavaScript deferral.
| Example Use Case:A small e-commerce store uses PageSpeed Insights to identify and fix slow-loading product pages, resulting in a 15% increase in mobile sales. |
2. GTmetrix
Overview:GTmetrix gives a detailed performance report, including load time, page size and recommendations for improvement.
Key Features:
- Waterfall charts to visualize loading processes.
- Browser-specific performance insights.
- Test mobile performance with various connection speeds.
| Example Use Case:A travel blog optimizes its homepage after GTmetrix highlights large, uncompressed images, reducing load time by 3 seconds. |
3. Pingdom Website Speed Test
Overview:Pingdom tests the speed of your website by making requests from multiple servers around the world. It makes this tool a great choice for business targeting international audience.
Key Features:
- Performance scores evaluated based on content size, requests, and load time.
- Time taken to loads elements of various content types (script, image etc).
- Historical performance tracking for long-term insights.
| Example Use Case: An online store performs an analysis of the site using European servers for faster service to European customers. |
4. Lighthouse
Overview:Google Lighthouse is an open-source tool to analyze performance, accessibility, SEO, and best practices.
Key Features:
- Audits website performance across various metrics.
- Provides actionable suggestions for improving scores.
- Available as a browser extension or within Chrome DevTools.
| Example Use Case: A SaaS startup develops a tool to accelerate the homepage speed of websites. The tool follows JavaScript interference that surfaced using Lighthouse. |
5. WebPageTest
Overview:WebPageTest enables advanced performance testing such as video playback of load pages and diagnostic insights.
Key Features:
- Multi-step transaction testing.
- Detailed visual load pattern for analysis.
- You can customize the parameters for your browser type and location.
| Example Use Case: A fintech platform benefits from performance web browser tests and utilizes WebPageTest to optimize user experience. |
6. Sematext Experience
Overview:Sematext Experience focuses on real user monitoring (RUM), providing insights into how actual visitors experience your site.
Key Features:
- Tracks Core Web Vitals in real-time.
- Monitors performance across different devices and regions.
- Provides detailed user session data.
| Example Use Case:A global e-learning platform improves its mobile user experience after Sematext highlights slow content rendering in specific regions. |
7. New Relic
Overview:New Relic’s performance monitoring services can be used to monitor the performance of your website, server and application. Because of this, it is a great solution for enterprise-level operations.
Key Features:
- Tracks server response times and application performance.
- Identifies bottlenecks in back-end processes.
- Provides real-time alerts for performance issues.
| Example Use Case: A software manufacturer of business enterprises utilized New Relic to observe database latency to improve its back-end by 30%. |
8. Uptime Robot
Overview:Uptime Robot helps you monitor your website’s uptime and informs you when it goes down.
Key Features:
- Pings your website every 5 minutes to ensure uptime.
- Sends instant notifications for downtime incidents.
- Provides historical data to track trends.
| Example Use Case: A media company does not get downtime as they set up instant alerts with Uptime Robot. |
How to Analyze Website Performance Data
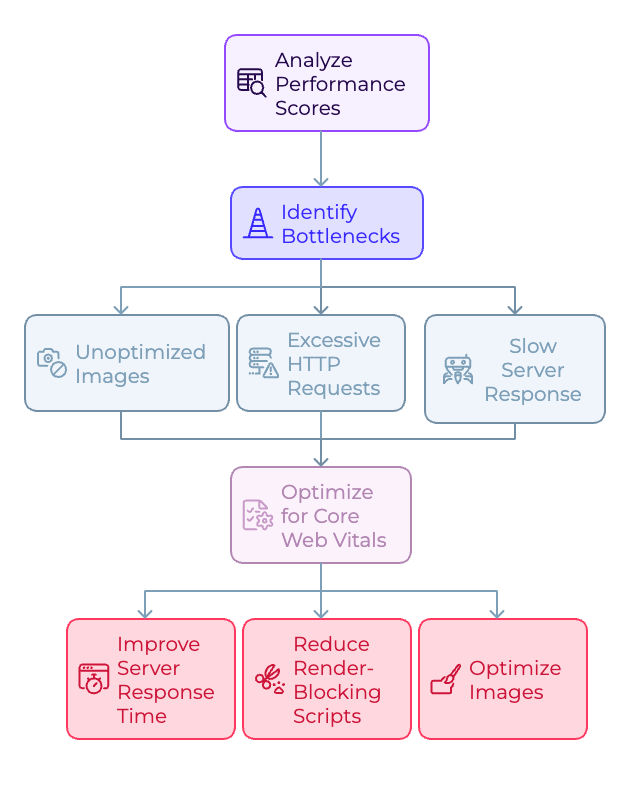
Interpreting Performance Scores
Most performance tools score based on various metrics they measure. Grasping these performance scores helps improve metrics.
Identifying Bottlenecks
All the commonly faced performance issues faced by your website are due to unoptimised images, various HTTP requests and slower server response time.
Optimizing for Core Web Vitals
Core Web Vitals are critical for performance. You can improve server response time, reduce render blocking scripts and optimize images
Tips to Improve Website Performance
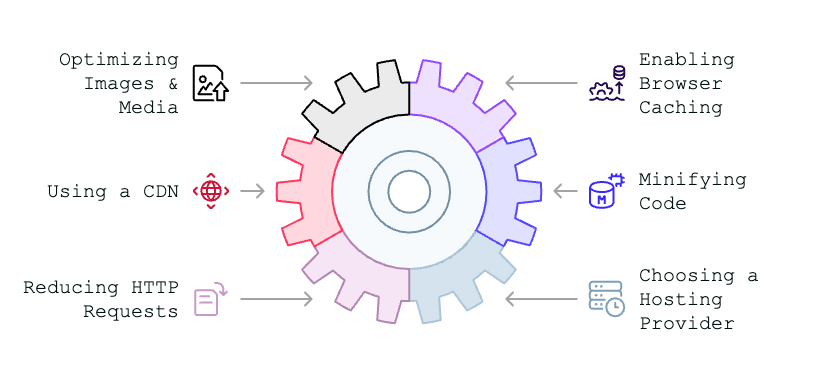
Optimizing Images & Media
Use next-gen formats like WebP, compress images, and implement lazy loading.
Enabling Browser Caching
Caching stores static assets, reducing load times for returning visitors.
Using a Content Delivery Network (CDN)
A CDN distributes website content across multiple global servers, improving speed and availability.
Minifying CSS, JavaScript, and HTML
Minification removes unnecessary characters from code, reducing file sizes and improving load times.
Reducing HTTP Requests
Combining CSS and JavaScript files, as well as limiting third-party scripts, can reduce HTTP requests.
Choosing the Right Hosting Provider
Selecting a reliable hosting provider with fast servers and scalable resources ensures optimal website performance.
Common Website Performance Issues & Fixes
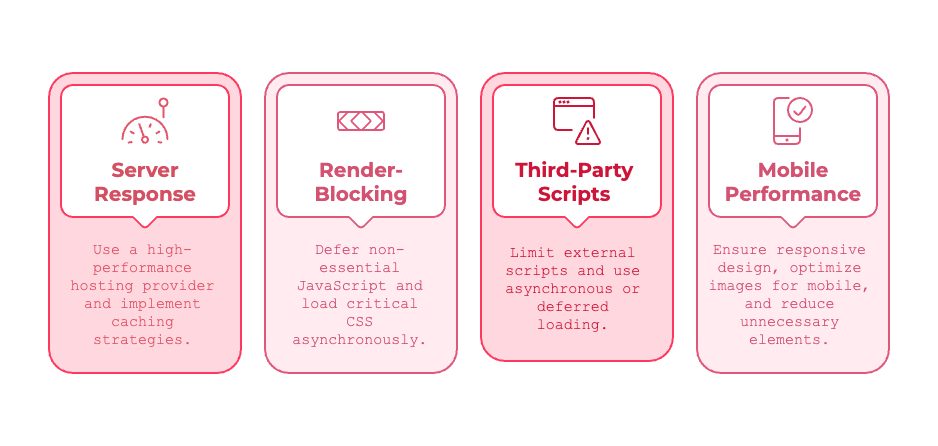
Slow Server Response Time
Use a high-performance hosting provider and implement caching strategies.
Render-Blocking Resources
Defer non-essential JavaScript and load critical CSS asynchronously.
Unoptimized Third-Party Scripts
Limit external scripts and use asynchronous or deferred loading.
Poor Mobile Performance
Ensure responsive design, optimize images for mobile, and reduce unnecessary elements.
Frequently Asked Questions (FAQs)
What is the best free website performance tool?
How often should I test my website performance?
Can performance tools detect security issues?
Does website performance affect SEO rankings?
How do I test mobile website performance?
What are Core Web Vitals, and why do they matter?
The Bottomline
A website’s performance must be monitored and optimized because of user experience, SEO and conversion. Tools like Google PageSpeed Insights, GTmetrix, and Lighthouse will give you insights that help you improve loading speeds. By choosing the right tool and measuring the right metrics, you will keep your website on top of the competition and provide an incredible user experience.
Start by picking a performance tool to analyze the site and optimize it for faster loading times and better results.